Gold Support and Resistance Explained
Support and resistance are the most familiar ideas in chart reading and the most misused. On gold, the fix starts with drawing zones instead of lines.

Key takeaways
- Support is an area where falling prices have repeatedly stopped; resistance is an area where rising prices have repeatedly stalled.
- On a volatile instrument like gold, levels behave like zones. Treating them as exact lines leads to premature stops and false breakouts.
- A broken level often changes role: former resistance can act as support, and former support as resistance.
- The most practical use of a level is to define where a trade idea is wrong, not only where to take profit.
In this article · 8 sections
The short answer
Support is an area on a chart where a falling price has repeatedly stopped and turned higher. Resistance is an area where a rising price has repeatedly stalled and turned lower. They matter because markets have memory: the places where buyers or sellers stepped in before tend to attract attention again.
On gold, the most important adjustment is to think of these as zones, not lines.
Why levels form
Price does not respect levels because of anything mystical. Several ordinary things tend to cluster orders around the same areas:
- Prior turning points. Traders who missed a reversal at a level often wait for price to return there.
- Positions left open. People who bought near a high and watched it fall may sell to break even when price comes back — adding supply at resistance.
- Round numbers. Whole-number prices are easy to remember and commonly used for orders. Research on currency markets has found that orders cluster at round numbers, which is one reason they can act as reaction points.
- Visible highs and lows. Everyone looks at the same obvious daily and weekly extremes.
Because the reasons are behavioural, the reactions are imperfect. A level describes where a reaction is more likely to happen, not where it must.
Zones, not lines
This is where gold differs from calmer instruments. Gold's swings are large and it reacts fast, so the price rarely turns at exactly the same point twice. It overshoots, it wicks through, it reverses a little early.
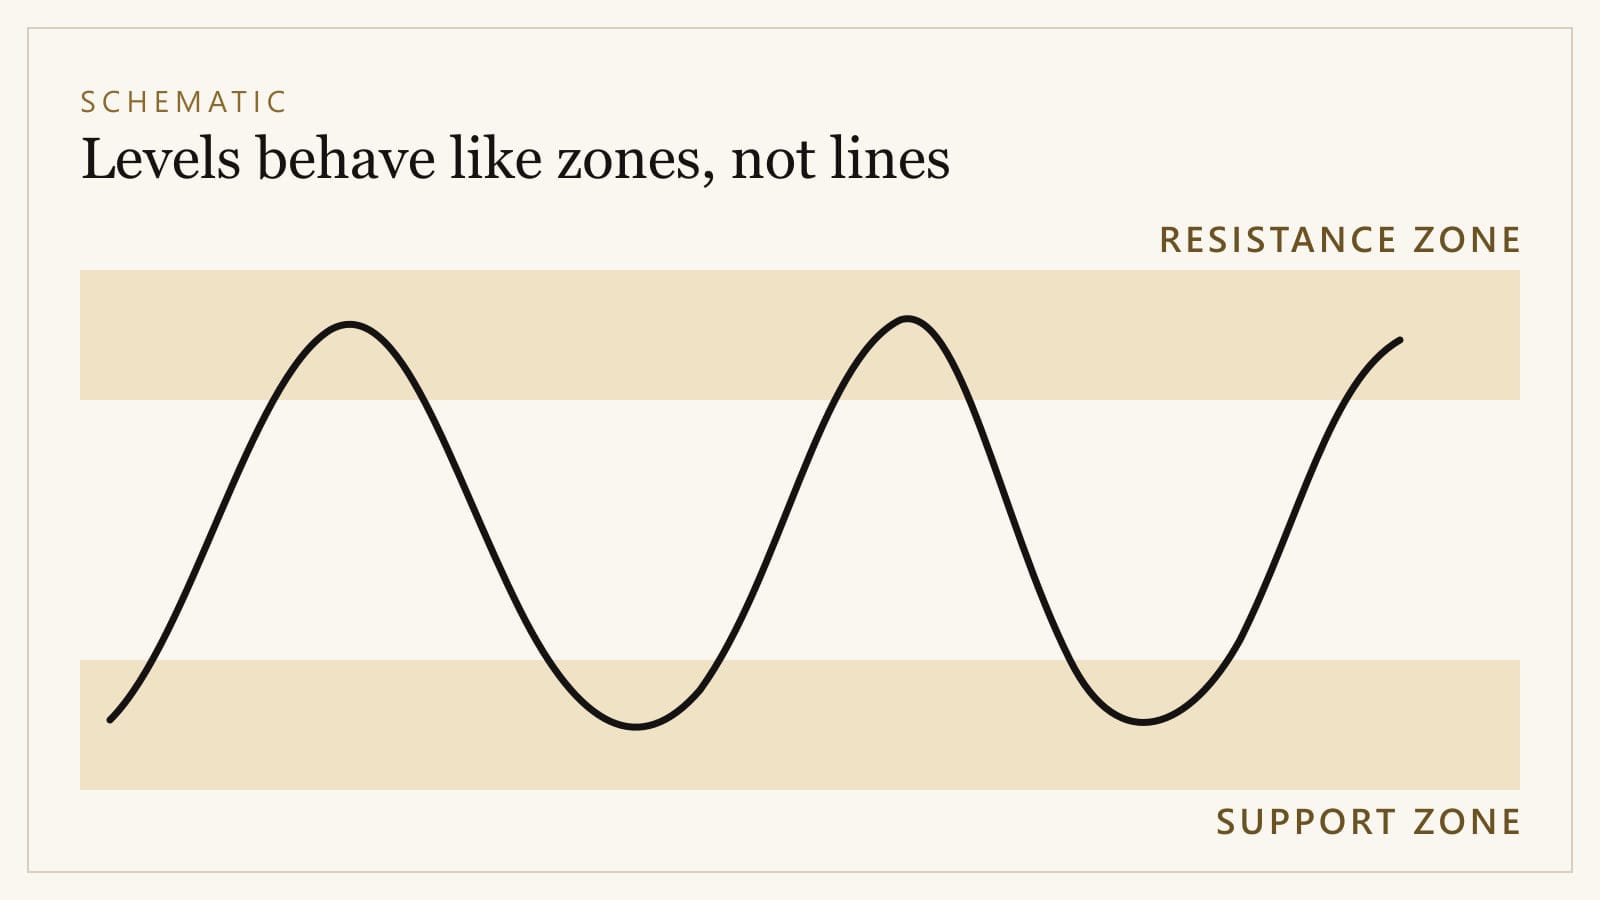
If you mark a level as a single line, you will constantly see it "broken" by moves that are really just gold being gold. If you mark it as a zone — spanning the range of the reactions around it — the chart becomes calmer and more honest.
A practical way to size a zone is to use the bodies and wicks of the candles that formed the reactions: the zone covers the area where price actually turned, not an idealised point inside it.
How to mark a zone
A few habits keep a chart useful rather than cluttered:
- Start on a higher timeframe. Daily and four-hour levels are fewer and usually more significant than those on a five-minute chart.
- Look for repeated, clear reactions. A level price has turned from several times, sharply, carries more weight than one brief pause.
- Prefer recent history. An area that mattered recently is more relevant than one from long ago that price has since ignored.
- Keep it sparse. A chart with twenty levels has a level everywhere, which is the same as having none.
Role reversal
When price breaks decisively through a level, that level frequently changes function. Broken resistance can become support on a later pullback; broken support can become resistance on a later bounce.
The logic is again behavioural. Traders who sold at the old resistance and watched it break may buy back if price returns there, and traders who missed the breakout may use the retest as an entry. It does not always happen, but it happens often enough that traders watch for it.
When a level breaks
Not every move through a level is a genuine break. On gold especially, false breaks — a push through a level that quickly reverses — are common. Some traders treat a break as more meaningful when:
- Price closes beyond the zone on the timeframe being used, rather than just trading through it.
- The move carries through clearly rather than hovering at the edge.
- A later retest of the zone from the other side holds.
None of these conditions guarantees anything. They are ways of asking for more evidence before acting.
Using levels to define risk
Most people use support and resistance to find entries and targets. The more valuable use is defining invalidation: the point at which the idea behind a trade no longer makes sense.
If a trade is based on a support zone holding, then a clear break below that zone means the premise has failed. That gives a logical place for a stop — beyond the zone, allowing for gold's normal noise, rather than a tight distance chosen to make a position look bigger. The distance to that stop is then what determines position size, as shown in our guide to gold trading risk management.
Common errors
- Drawing lines, not zones — and then being stopped out by ordinary volatility.
- Stops placed exactly at the level — where many other stops sit, and where a brief overshoot is most likely.
- Too many levels from too many timeframes.
- Treating a level as a prediction rather than an area of likely reaction.
- Ignoring context. A support zone in a strong downtrend is more likely to break than one in an uptrend. The article on reading a gold market trend covers how to judge that context.
Support and resistance are one tool among several. To see how they fit alongside the instrument, its drivers and its risks, read our introduction to how gold trading works.
Sources and references
- Currency Orders and Exchange-Rate Dynamics: Explaining the Success of Technical Analysis (Staff Report No. 125, C. L. Osler) — Federal Reserve Bank of New YorkCentral bank · retrieved 21 September 2026