How to Read a Gold Market Trend
A trend is not a feeling that price is going up. It is a structure you can point to on a chart, and one you can watch break.

Key takeaways
- An uptrend is a sequence of higher highs and higher lows; a downtrend is lower highs and lower lows.
- A trend only exists on a timeframe. Gold can trend up on a daily chart while falling on an hourly one.
- Moving averages summarise past prices and always lag. They describe a trend rather than forecast it.
- A trend view needs a defined point where it is wrong — usually the most recent swing low or high.
In this article · 9 sections
The short answer
To read a trend in gold, look at the structure of highs and lows on a chosen timeframe. Rising highs and rising lows describe an uptrend; falling highs and falling lows describe a downtrend; highs and lows that go nowhere describe a range. Everything else — moving averages, trendlines, indicators — is a way of summarising that same structure.
The more useful skill is not spotting a trend. It is knowing, in advance, what would tell you it has ended.
Structure first: highs and lows
Price does not move in straight lines. It moves in swings: a push in one direction, a pullback, another push. Each swing leaves a turning point — a swing high or a swing low — and the relationship between those points is the trend.
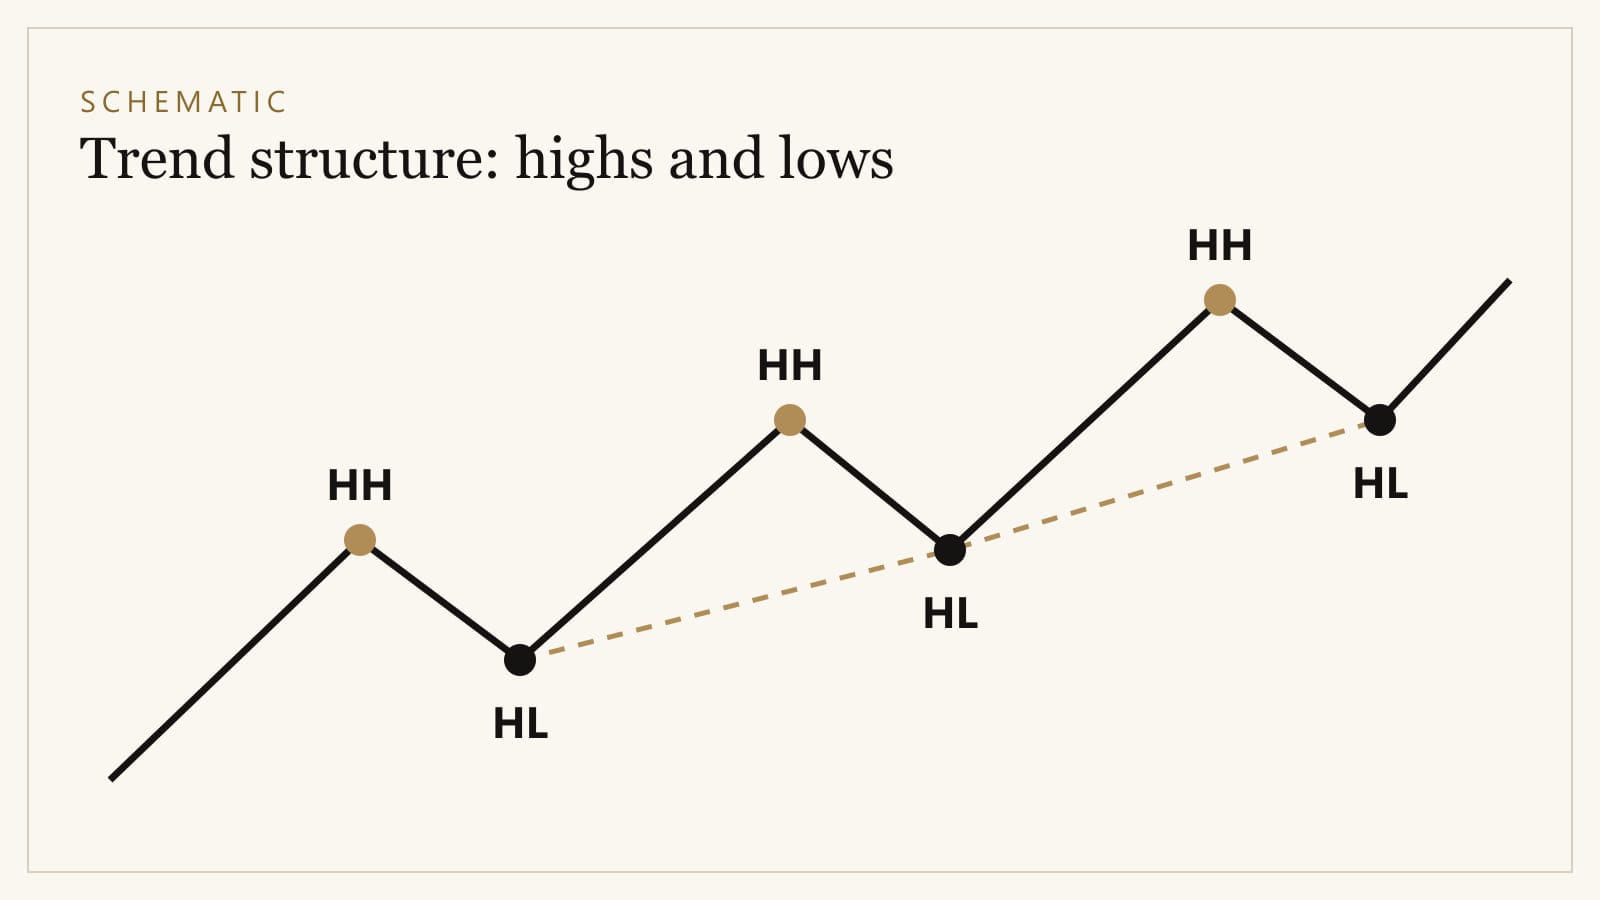
- Uptrend: each rally makes a higher high, and each pullback stops at a higher low.
- Downtrend: each decline makes a lower low, and each bounce stops at a lower high.
- Range: highs and lows cluster around similar levels, with no progression either way.
The value of reading structure this way is that it is specific. "Gold looks strong" is an opinion. "Gold has made three higher lows on the four-hour chart, and the last one sits here" is an observation someone else can check.
Timeframes decide which trend you mean
There is no such thing as the trend. There is the trend on a particular timeframe.
Gold can be in a clear uptrend on the daily chart while making lower highs on the hourly chart, because a pullback within a larger rise is itself a small downtrend. Both descriptions are correct at the same time.
This is where many beginners get confused, so a simple discipline helps:
- Decide your main timeframe — the one your trades are actually planned on.
- Check one timeframe above it for context. It tells you whether your trend is moving with or against the larger picture.
- Use a lower timeframe, if at all, only for timing — not to change your view of the trend.
Traders who switch timeframes to find a picture that agrees with them are not reading the market; they are shopping for confirmation.
Moving averages: a summary, not a signal
A moving average smooths price by averaging it over a set number of periods. A simple moving average weights each period equally; an exponential moving average gives more weight to recent prices, so it reacts faster.
Moving averages are useful for one thing: making the direction of a trend easy to see at a glance. Price holding above a rising average suggests an uptrend; below a falling one, a downtrend; weaving back and forth through a flat one, a range.
Their limitation is built in. An average of past prices can only follow price, never lead it. When a trend reverses, the average turns late — which is why crossovers of two averages so often arrive after much of the move is already over, and so often produce false signals when the market is ranging.
Trendlines and their weaknesses
A trendline joins successive swing lows in an uptrend, or swing highs in a downtrend. It is a clear way to visualise structure, but it is also one of the most subjective tools on a chart. Two traders can draw different lines on the same data, and a line can be redrawn after every break to keep a story alive.
Treat a trendline as a sketch of the structure, not as a boundary price must respect. On a volatile instrument such as gold, price will often pierce a line briefly without the trend ending. The swing points themselves are more reliable than the line drawn through them.
Ranges: when there is no trend
Gold does not trend all the time. Like any market, it can move sideways for extended periods between broad areas where it has repeatedly turned. Recognising a range matters because the tools that work in a trend tend to fail in one: breakouts fizzle, averages whipsaw, and positions opened in the direction of the "trend" get stopped out repeatedly.
When highs and lows stop progressing, the most honest description is that there is no trend on that timeframe. The explainer on gold support and resistance looks at how traders map the edges of a range.
Signs a trend is weakening
Trends rarely end without warning. Common early signs include:
- A failed high. In an uptrend, a rally that fails to exceed the previous high.
- Shallower progress. Each new high clears the last by less than before.
- Deeper pullbacks. Retracements start eating further into the prior move.
- A break of structure. The clearest sign: price falls below the most recent higher low.
None of these proves a reversal. Together, they tell you the market is behaving differently from before.
What invalidates a trend view
This is the part that matters most for risk. A trend view should come with a stated point where it is wrong.
In an uptrend, that point is usually the most recent higher low. If price closes below it, the sequence of higher lows is broken and the uptrend, as defined, no longer exists. In a downtrend, the equivalent is the most recent lower high.
Writing that level down before acting does two things. It turns an opinion into something testable, and it gives you the stop distance you need to size a position properly — the calculation explained in gold trading risk management.
How this fits with everything else
Trend structure tells you how gold has been moving. It says nothing about why. A clean uptrend can end abruptly on an interest-rate surprise, which is why structure is best read alongside the forces covered in what moves the price of gold. For the full picture in order, start with the beginner's overview of gold and XAUUSD.
Sources and references
- What Is EMA? — Exponential Moving Average — FidelityPublication · retrieved 21 September 2026